Examining data in your business can provide much insight into how your business is running, customer behaviors, financials, and so much more. Through examining large amounts of data you can uncover hidden patterns, correlations, and other insights.
With todays technology such as Power BI you can have rapid insight to extract data from multiple sources and bring it into one single pane of glass. We meet with Nigel Posting who shows us the power of data and how easy it can be to examine and extract what you need through Power BI.
Video Transcription
Harry Brelsford
Hey nation nation back with nitro postings. Happy New Year. How you doing?
Nigel Postings
Good. Thank you Happy New Year to you from Rainy but not snowy Seattle.
Harry Brelsford
There we go. I'm in sunny Austin, so I won't rub it in. But hey, let's This is cool. Let's just jump right into the good stuff, what are we looking at?
Nigel Postings
So what we're looking at so as we spoke many times, besides he's working with some pretty major clients, and we help them in one of three ways. This is, by the way, we're looking at Power BI data that will the reviews. So we have been one of three ways. Number one, we help clients assess their channel. Two projects we worked on in the last quarter of last year was one with a major provider. And we looked across 50,000 plus companies in the US scoring them for their property for our clients. Another project in Europe we worked on as scoring 78,000 MSPs and resellers assessing, assessing their business, what we call the long tail. So the company we lost contact, and wanted to know Hey, what are these? What are these companies doing? So this is a representation of the data? I love to just run through very quickly a two minute drill. If that's okay, yeah, yeah, give
Harry Brelsford
it a shot, man.
Nigel Postings
Okay, all right. So what we work off is a domain, that's our single point of truth. The domain is what we take and then look at and score the performance of the partner. In this case, it could be an end customer being asked to look into the future. With the domain. First of all, we go out and we bring in what we call thermographic data. So for any given company, how many employees ever got, what revenue they're doing, or revenue band? Where are the base? Which country? What type of company? Did they say they are? Are they computer software company? I see. So look at all the codes, standard industry codes, we look at the country, the baseline as well. So base level set of saying, Okay, this is the firma graphic of the data of these clients. One thing we also do is we identify, especially if it's old data, are these companies still in business. And we're seeing typically between anything from seven to 80% companies that no longer exist, it could be they've been acquired by a large company, or they just go out of business. So once we have the basic
Harry Brelsford
app, just under 20%, is what I heard yet 20%
Nigel Postings
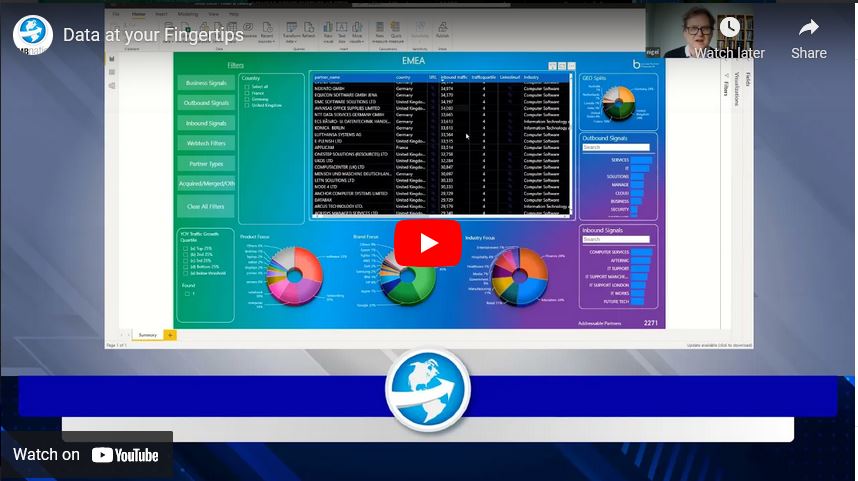
of the purchase we did in the cross the 100,000 balance one client 18% no longer there. Okay, go on, how's it gonna depend on the age of the data? Well, that's why we like to do refreshes, we then look at the general performance of the partner. And we use traffic as approximate traffic as a proxy for revenue. Some of these obviously are high. But obviously, we get down to very small partners, and we sort of say, what was a monthly traffic last month for that particular company. So it gives you when you're comparing hundreds 1000s of partners or customers, who's relatively doing well in getting customers to their website. And so that's, that's number one. What we can also look at is traffic over the last three years. And we can put them into sort of groups and say, Okay, who's growing the traffic the most, who's performing well, and obviously, during COVID, some of our clients are in the reseller space, and moving from brick and mortar to online. So we're seeing changes and seeing where companies are really developing their e commerce capabilities. What we can also do with traffic is identify where the customers are coming from which countries. So if you're a vendor, and you're looking to understand where you have coverage with your partners or customers, this is a great way tells you, where you were mostly partners, customers are aware there's gaps in the market. So that's the first base, then what we do we go out and we scrape at scale, you know, over the over the holiday period, we just got another 400,000 partners, we identify who, what and they are promoting, are they promoting a particular vendor, say Microsoft either promoting a particular solution, say Azure, are they promoting a given industry, financial services? So across your partners or your potential partners in a recruit, you can get to understand what is that based business? What are they doing, what they're promoting? And so it's good to have all that traffic signals and growth signals, we can really put you to the right partners you have to deal with are the ones you want to be working with. Next we'll look at inbound signals, inbound signals tells me why is the customer going to my partner's website? What are they searching for? Are they searching for SMB solutions? Are they searching for office 365 You name it, we can identify the intent of a customer going to partners website. So if you're VP of channel marketing, VP Channel Sales, you have a perfect early view of customer intent around your partners and so you can start to identify the gaps and also reward those partners you think you're driving the most customer interest. Finally we look at Webtech filters. Webtech filters tells me what type of technology the partner is using. Are they running myself on my So platform are they running on an Amazon platform AWS. So again, you get an attentive how sophisticated they are internally for using technology. So this gives a complete view. And at the bottom of just would power the I just sort of showed, okay, for this given set of partners, we see finance and education as a key industries. We see Microsoft, Google, Apple and HP are the key brands that have been promoted. And then you start to see some of the products focus. The nice thing about Power BI, in this instance, this is a blank sheet of paper, this is a Picasso. So you can put onto the Power BI dashboard, any data you want to have all this data today is external, publicly available, you can go do this from your desktop, but we can do this at scale for partners and vendors. And so you can start to think you can even ovulate internal data. So it gives you complete view, slicing time, the performance of your customers or your partners. So there you have it. That's the 360 degree view hurry,
Harry Brelsford
man, I'll tell you, this is yeah, this is amazing. Hey, next time, if you don't mind, because this is really good for the SMB Nation audience, you know, I've been pushing analytics for some time. And in all fairness, analytics isn't for everybody. Okay, so it's, it's, it's a different animal. But maybe next time, if we could do I want to say almost like a little quick and dirty hands on lab, maybe we could actually build some things that are podcasts.
Nigel Postings
I can show you how we build this Power BI. One of the things I want to make sure is, you know, SMB Nation, you know, this is technology partners, but this could be anything. I'm talking to an ice cream company today about their distribution, I think about their own customers, restaurants, hotels. So data is data, and how you then bring the data in to tell the story. That's, that's what we're about and using Power BI as an interface for that, but let's do let's do it.
Harry Brelsford
Alright, we'll make it happen. Thanks.
Nigel Postings
Okay. All right. Good time. GRC